Learn Visualization
10 expert-rated courses covering Visualization. Compared by rating, price, difficulty, and job relevance so you can pick the right one.
The SkillsetCourse catalog indicates a robust offering for learning Visualization, with 11 courses available across platforms like Weights & Biases, Coursera, and Skillshare. Among these, 4 courses are free and 3 provide certificates upon completion. Related skills such as Python and Data Analysis support a comprehensive learning experience, ensuring learners can apply Visualization techniques effectively in real-world scenarios.
Catalog analysis updated . Ratings are independent editorial scores. Read the rating methodology.
Key Facts About Visualization
- 1Visualization helps in making complex data comprehensible through graphical representation.
- 2SkillsetCourse offers 11 courses focusing on Visualization across multiple platforms.
- 3Four free courses are available for learners interested in Visualization.
- 4Three courses provide certificates, enhancing credentials in data-related fields.
- 5Related skills include Data Science, Python, and Statistics, which complement Visualization training.
Available on
Top Visualization Courses

Weights & Biases 101
Introductory course on experiment tracking, visualization, collaboration, and optimization workflows in Weights & Biases.

Data Science and Machine Learning with Python
By the end of this class, you will not only have a solid understanding of data science and analytics but also be able to quickly learn new libraries and tools.
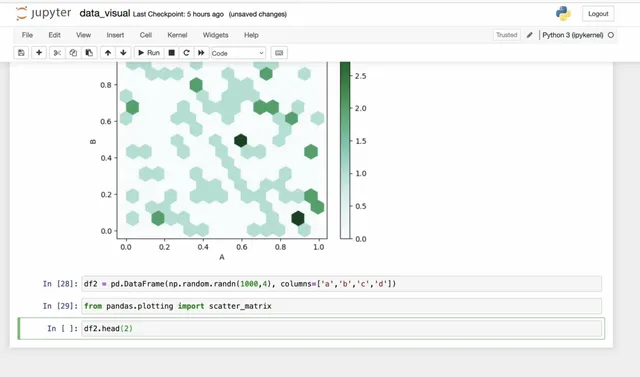
Pandas for Data Analysis: Master Data Handling in Python
This course covers everything from setting up your working environment with Anaconda and Jupyter Notebook to mastering the core features of Pandas.

Excel to Python: A Data Science Crash Course
Introduction: Do you do data science with Excel and then Python? And welcome to a Skillshare crash course where you will learn the fundamentals of Python for ...
Data Visualization with Matplotlib: From Basics to Advanced ...
In this course, you'll master data visualization using Matplotlib, one of the most powerful libraries in Python.
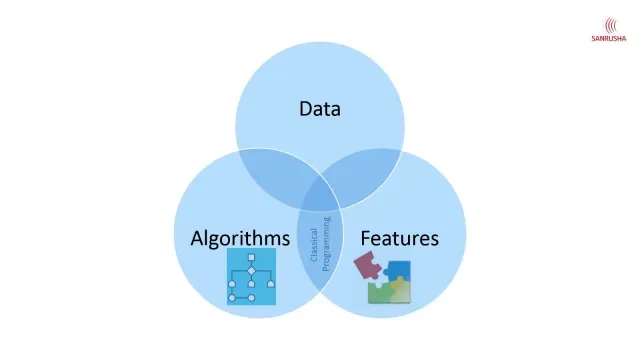
Machine Learning with Python and Scikit-learn for absolute beginners
This course covers how to build Machine Learning models from scratch using Python and Scikit-learn libraries. Course structure is captured below.

Python For Beginners: Master the Essential Basics of Python
By learning Python, you're preparing yourself for a future in: Data Science and Analytics: Process, analyze, and visualize data to make smarter decisions.

The No-Code Data Science Masterclass for Business Analysts ...
We will cover the expectations, steps, and vocabulary needed to make data-driven decisions. This class is tool-agnostic and can be applied in multiple contexts ...
Master AutoCAD 3D: Create, Model, Transform Designs
Advance your AutoCAD skills to create professional 3D models and designs. This course covers 3D modeling techniques, visualization, rendering, and transformation for product design and visualization.

Apply SketchUp to Build 3D House Models from 2D Plans
Transform 2D architectural plans into stunning 3D models using SketchUp, the industry-standard tool for architecture and construction. This course teaches practical techniques for architectural visualization, design iteration, and presenting building designs effectively.
Pro Tips for Learning Visualization
- #1Start with 'Weights & Biases 101' to gain foundational knowledge in Visualization techniques.
- #2Practice using tools like Matplotlib to create visualizations from datasets you encounter.
- #3Combine Visualization learning with Python programming to enhance your data manipulation skills.
- #4Regularly review and analyze existing visualizations to understand best practices and common pitfalls.
Why Learn Visualization?
- Learning Visualization can significantly enhance your data storytelling abilities, making you more effective in data-driven roles.
- Mastering Visualization is essential for professionals in Data Science, as it aids in decision-making.
- Visualization skills are increasingly sought after in various industries, improving job market competitiveness.
- Acquiring Visualization knowledge can lead to better communication of insights, benefiting team collaboration.